VOWR is an R package for analysing monthly Referral-to-Treatment (RTT) waiting-time data in healthcare systems.
It provides an end-to-end statistical workflow for:
The package is designed for healthcare analysts, applied statisticians, operational researchers, NHS performance teams, and health-services researchers.
Healthcare waiting-time monitoring often relies on static averages. VOWR extends this by combining risk profiling, volatility detection, and survival-based breach modelling.
It helps answer questions such as:
During local development, load the package with:
devtools::load_all()After GitHub release, users will be able to install using:
# install.packages("devtools")
# devtools::install_github("zerish12/VOWR")VOWR expects provider-month RTT data with the following columns:
| Column | Description |
|---|---|
provider_org_code |
Provider organisation code |
provider_org_name |
Provider organisation name |
period |
Month/date of observation |
mean_wait_weeks |
Mean waiting time in weeks |
backlog_total |
Total backlog |
bucket_total |
Total waiting-time bucket count |
library(VOWR)

data <- vowr_import()

head(data)
#>   provider_org_code                                       provider_org_name
#> 1             A0C5S                                    SPAMEDICA GLOUCESTER
#> 2               RC9             BEDFORDSHIRE HOSPITALS NHS FOUNDATION TRUST
#> 3               RBV                       THE CHRISTIE NHS FOUNDATION TRUST
#> 4               RBT             MID CHESHIRE HOSPITALS NHS FOUNDATION TRUST
#> 5               RBS               ALDER HEY CHILDREN'S NHS FOUNDATION TRUST
#> 6               RBQ LIVERPOOL HEART AND CHEST HOSPITAL NHS FOUNDATION TRUST
#>       period mean_wait_weeks backlog_total bucket_total
#> 1 01/10/2023        4.871831           950          710
#> 2 01/10/2023       20.628635        276210       239142
#> 3 01/10/2023        6.421240         11966         9294
#> 4 01/10/2023       21.395905        125128       107844
#> 5 01/10/2023       21.765385         71426        64480
#> 6 01/10/2023 15.741076 19338 16584vowr_profile() summarises provider-level waiting-time
performance.
profile <- vowr_profile(data)

head(profile)
#> # A tibble: 6 × 7
#>   provider_org_code provider_org_name  n_months mean_wait median_wait volatility
#>   <chr>             <chr>                 <int>     <dbl>       <dbl>      <dbl>
#> 1 8KL73             ENDOCARE DIAGNOST…        3      1.47        1.48      0.106
#> 2 A0C5S             SPAMEDICA GLOUCES…       24      4.77        4.79      0.979
#> 3 A1D1B             SPAMEDICA WEMBLEY         9      4.31        4.86      1.17
#> 4 A1U4J             SPAMEDICA PORTSMO…       17      4.83        5.10      1.72
#> 5 A4M8P             BUCKSHAW HOSPITAL        24     15.5        15.4       1.40
#> 6 A4Q9X             NEWMEDICA LEICEST…       22      3.99        3.16      2.23
#> # ℹ 1 more variable: total_backlog <int>
The output includes:
vowr_flag() classifies providers into operational risk
groups.
flagged <- vowr_flag(profile)

table(flagged$risk_flag)
#>
#> Critical (Breach & Unstable)                High (Breach)
#>                           21                          114
#>                       Stable           Warning (Unstable)
#>                          398                           36
Risk groups are defined as:
| Risk group | Meaning |
|---|---|
Stable |
Provider is below threshold and not highly volatile |
Warning (Unstable) |
Provider is volatile but not currently above threshold |
High (Breach) |
Provider is above the waiting-time threshold |
Critical (Breach & Unstable) |
Provider is both above threshold and highly volatile |
vowr_plot() produces a provider risk map showing mean
waiting time against volatility.
risk_plot <- vowr_plot(flagged)

print(risk_plot)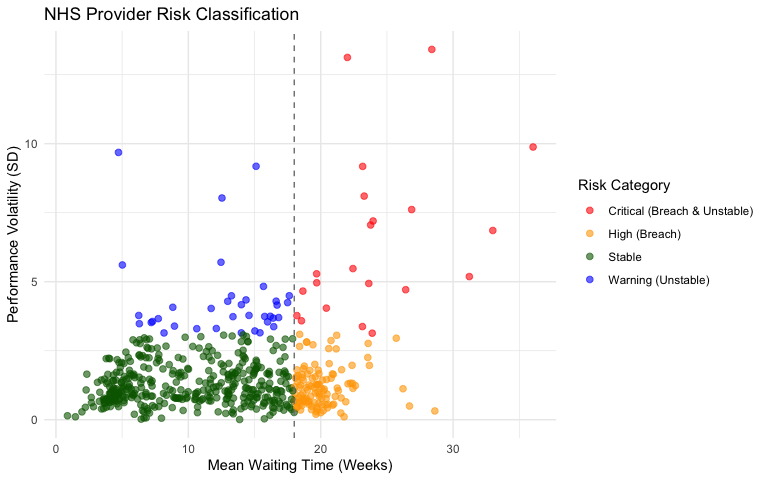
This plot helps identify providers with high waiting times, high volatility, or both.
vowr_survival() estimates time until a provider first
breaches the waiting-time threshold.
surv <- vowr_survival(data)

surv$fit
#> Call: survfit(formula = surv_obj ~ 1)
#>
#>        n events median 0.95LCL 0.95UCL
#> [1,] 551    216     NA      NA      NA

head(surv$surv_data)
#> # A tibble: 6 × 6
#>   provider_org_code start_date end_date   first_breach status time_days
#>   <chr>             <date>     <date>     <date>        <dbl>     <dbl>
#> 1 8KL73             2024-06-01 2024-08-01 NA                0        61
#> 2 A0C5S             2023-10-01 2025-12-01 NA                0       792
#> 3 A1D1B             2025-04-01 2025-12-01 NA                0       244
#> 4 A1U4J             2024-08-01 2025-12-01 NA                0       487
#> 5 A4M8P             2023-10-01 2025-12-01 2023-11-01        1        31
#> 6 A4Q9X             2024-03-01 2025-12-01 NA                0       640
The survival output includes:
vowr_survival_merge() combines survival output with
provider profiles and risk groups.
surv_profile <- vowr_survival_merge(
  surv_result = surv,
  profile = profile,
  flagged = flagged
)

head(surv_profile)
#> # A tibble: 6 × 13
#>   provider_org_code start_date end_date   first_breach status time_days
#>   <chr>             <date>     <date>     <date>        <dbl>     <dbl>
#> 1 8KL73             2024-06-01 2024-08-01 NA                0        61
#> 2 A0C5S             2023-10-01 2025-12-01 NA                0       792
#> 3 A1D1B             2025-04-01 2025-12-01 NA                0       244
#> 4 A1U4J             2024-08-01 2025-12-01 NA                0       487
#> 5 A4M8P             2023-10-01 2025-12-01 2023-11-01        1        31
#> 6 A4Q9X             2024-03-01 2025-12-01 NA                0       640
#> # ℹ 7 more variables: provider_org_name <chr>, n_months <int>, mean_wait <dbl>,
#> #   median_wait <dbl>, volatility <dbl>, total_backlog <int>, risk_flag <chr>
vowr_km_by_risk() then produces Kaplan-Meier curves
comparing time-to-breach across risk groups.
km_plot <- vowr_km_by_risk(surv_profile)

print(km_plot)
This figure assesses whether providers classified into different risk groups show different breach trajectories.
vowr_cox_model() estimates a Cox proportional hazards
model using provider-level risk indicators.
cox_fit <- vowr_cox_model(surv_profile)

summary(cox_fit)
#> Call:
#> survival::coxph(formula = survival::Surv(time_days, status) ~
#>     mean_wait + volatility + total_backlog, data = model_data)
#>
#>   n= 607, number of events= 234
#>
#>                     coef  exp(coef)   se(coef)      z Pr(>|z|)
#> mean_wait      2.327e-01  1.262e+00  1.533e-02 15.180  < 2e-16 ***
#> volatility    -3.745e-02  9.632e-01  3.924e-02 -0.954     0.34
#> total_backlog  1.166e-07  1.000e+00  2.569e-08  4.537 5.71e-06 ***
#> ---
#> Signif. codes:  0 '***' 0.001 '**' 0.01 '*' 0.05 '.' 0.1 ' ' 1
#>
#>               exp(coef) exp(-coef) lower .95 upper .95
#> mean_wait        1.2620     0.7924    1.2246      1.30
#> volatility       0.9632     1.0382    0.8919      1.04
#> total_backlog    1.0000     1.0000    1.0000      1.00
#>
#> Concordance= 0.92  (se = 0.01 )
#> Likelihood ratio test= 437.8  on 3 df,   p=<2e-16
#> Wald test            = 399  on 3 df,   p=<2e-16
#> Score (logrank) test = 512.8  on 3 df,   p=<2e-16
The Cox model supports statistical inference about the association between provider characteristics and faster threshold breach.
The full pipeline can also be run with
vowr_workflow().
result <- vowr_workflow(data)

names(result)
#> [1] "profile"          "flagged"          "risk_plot"        "survival"
#> [5] "survival_profile" "cox_model"        "km_risk_plot"
The workflow returns:
| Object | Description |
|---|---|
profile |
Provider-level summary table |
flagged |
Provider profile with risk groups |
risk_plot |
Risk classification plot |
survival |
Survival model output |
survival_profile |
Merged survival-profile-risk dataset |
cox_model |
Cox proportional hazards model |
km_risk_plot |
Kaplan-Meier plot by risk group |
Example:
print(result$km_risk_plot)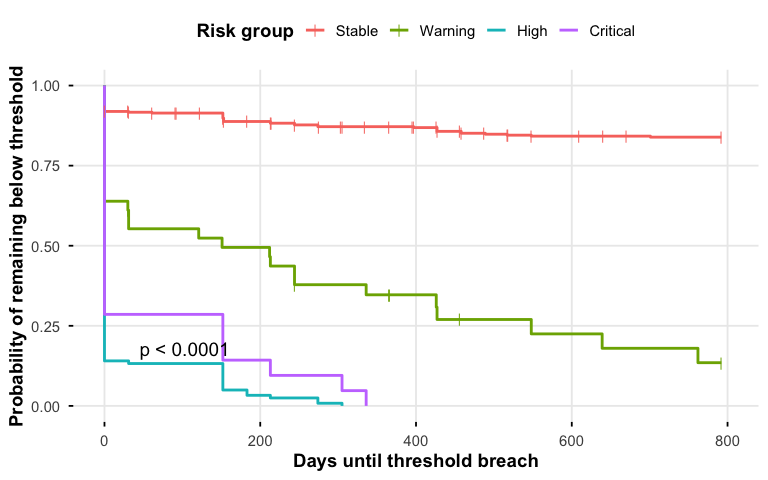
summary(result$cox_model)
#> Call:
#> survival::coxph(formula = survival::Surv(time_days, status) ~
#>     mean_wait + volatility + total_backlog, data = model_data)
#>
#>   n= 607, number of events= 234
#>
#>                     coef  exp(coef)   se(coef)      z Pr(>|z|)
#> mean_wait      2.327e-01  1.262e+00  1.533e-02 15.180  < 2e-16 ***
#> volatility    -3.745e-02  9.632e-01  3.924e-02 -0.954     0.34
#> total_backlog  1.166e-07  1.000e+00  2.569e-08  4.537 5.71e-06 ***
#> ---
#> Signif. codes:  0 '***' 0.001 '**' 0.01 '*' 0.05 '.' 0.1 ' ' 1
#>
#>               exp(coef) exp(-coef) lower .95 upper .95
#> mean_wait        1.2620     0.7924    1.2246      1.30
#> volatility       0.9632     1.0382    0.8919      1.04
#> total_backlog    1.0000     1.0000    1.0000      1.00
#>
#> Concordance= 0.92  (se = 0.01 )
#> Likelihood ratio test= 437.8  on 3 df,   p=<2e-16
#> Wald test            = 399  on 3 df,   p=<2e-16
#> Score (logrank) test = 512.8 on 3 df, p=<2e-16| Function | Purpose | Output |
|---|---|---|
vowr_import() |
Import RTT data | Data frame |
vowr_profile() |
Profile provider waiting-time performance | Summary table |
vowr_flag() |
Classify providers into risk groups | Risk-labelled table |
vowr_plot() |
Visualise provider risk | ggplot object |
vowr_survival() |
Estimate threshold-breach survival model | Survival fit and data |
vowr_survival_merge() |
Merge survival output with profile and risk flags | Analysis dataset |
vowr_km_by_risk() |
Plot Kaplan-Meier curves by risk group | Survival plot |
vowr_cox_model() |
Estimate Cox proportional hazards model | Cox model object |
vowr_workflow() |
Run the full VOWR pipeline | List of outputs |
A typical VOWR analysis may show that:
This makes VOWR useful for:
A VOWR analysis can be summarised as:
Provider-level waiting-time profiles were constructed from monthly RTT panel data. Providers were classified into operational risk groups using mean waiting time and volatility. Time-to-threshold breach was examined using Kaplan-Meier survival curves and Cox proportional hazards models.
Current development status:
If you use VOWR in research or applied analysis, please cite:
Khan MZ. VOWR: Vital Operational Waiting Risk for Healthcare Systems.
R package version 0.1.0.Dr Muhammad Zahir Khan
Independent Researcher, United Kingdom
PhD in Applied Statistics
Member, Royal Statistical Society
Email:
zahirstat007@gmail.com
ORCID: https://orcid.org/0009-0005-7645-8960
This package is released under the MIT License.
VOWR is intended for statistical analysis, research, and operational monitoring. It should support, not replace, expert judgement in healthcare planning, management, or policy decisions.