![]()
An R package to easily retrieve ERVISS (European Respiratory Virus Surveillance Summary) data from the EU-ECDC. Provides functions to fetch, filter, and optionally visualize respiratory virus surveillance data across European countries.
Please visit https://erviss.org/ for a detailed description of the underlying data (see ‘Methods’ in the footer).
install.packages("pak")
pak::pak("Epiconcept-Paris/ervissexplore")library(ervissexplore)
# Retrieve SARS-CoV-2 positivity data
positivity_data <- get_sentineltests_positivity(
date_min = as.Date("2024-01-01"),
date_max = as.Date("2024-12-31"),
pathogen = "SARS-CoV-2",
countries = c("France", "Germany", "Italy")
)
head(positivity_data)
#> survtype countryname yearweek pathogen pathogentype
#> <char> <char> <char> <char> <char>
#> 1: primary care sentinel France 2024-W52 SARS-CoV-2 SARS-CoV-2
#> 2: primary care sentinel France 2024-W52 SARS-CoV-2 SARS-CoV-2
#> 3: primary care sentinel France 2024-W52 SARS-CoV-2 SARS-CoV-2
#> 4: primary care sentinel France 2024-W51 SARS-CoV-2 SARS-CoV-2
#> 5: primary care sentinel France 2024-W51 SARS-CoV-2 SARS-CoV-2
#> 6: primary care sentinel France 2024-W51 SARS-CoV-2 SARS-CoV-2
#> pathogensubtype indicator age value date
#> <char> <char> <char> <num> <Date>
#> 1: SARS-CoV-2 detections total 3.0 2024-12-23
#> 2: SARS-CoV-2 positivity total 2.1 2024-12-23
#> 3: SARS-CoV-2 tests total 142.0 2024-12-23
#> 4: SARS-CoV-2 detections total 13.0 2024-12-16
#> 5: SARS-CoV-2 positivity total 4.1 2024-12-16
#> 6: SARS-CoV-2 tests total 319.0 2024-12-16The package fetches data directly from the EU-ECDC Respiratory Viruses Weekly Data repository.
Seven data sources are available:
| Data source | Function | Description |
|---|---|---|
| Sentinel positivity | get_sentineltests_positivity() |
Test positivity rates by pathogen |
| SARS-CoV-2 variants | get_erviss_variants() |
Variant proportions and detections |
| ILI/ARI rates | get_ili_ari_rates() |
ILI/ARI consultation rates by age group |
| SARI rates | get_sari_rates() |
SARI hospitalisation rates by age group |
| SARI virological | get_sari_positivity() |
SARI tests, detections and positivity |
| Non-sentinel severity | get_nonsentinel_severity() |
Deaths, hospital and ICU admissions |
| Non-sentinel tests | get_nonsentinel_tests() |
Non-sentinel tests and detections |
A generic function get_erviss_data(type = ...) can also
be used to access any of the above sources.
By default, functions fetch the latest available data. For reproducibility, you can use historical snapshots:
# Use a specific snapshot for reproducible analyses
data <- get_sentineltests_positivity(
  date_min = as.Date("2023-01-01"),
  date_max = as.Date("2023-12-31"),
  use_snapshot = TRUE,
  snapshot_date = as.Date("2024-02-23")
)
To see available snapshot dates, visit the EU-ECDC Respiratory Viruses Weekly Data repository.
# Get positivity data (returns a data.table)
data <- get_sentineltests_positivity(
  date_min = as.Date("2024-01-01"),
  date_max = as.Date("2024-06-30"),
  pathogen = c("SARS-CoV-2", "Influenza"),
  countries = c("France", "Spain", "Italy"),
  indicator = "positivity"
)

# Your own analysis with data.table syntax
data[,
  .(
    min_positivity = min(value, na.rm = TRUE),
    mean_positivity = mean(value, na.rm = TRUE),
    max_positivity = max(value, na.rm = TRUE)
  ),
  by = .(countryname, pathogen)
]
#>    countryname   pathogen min_positivity mean_positivity max_positivity
#>         <char>     <char>          <num>           <num>          <num>
#> 1:      France  Influenza            0.0       19.223077           58.7
#> 2:      France SARS-CoV-2            0.0        8.942308           66.7
#> 3:       Italy  Influenza            0.6       12.670588           40.5
#> 4:       Italy SARS-CoV-2            0.0        2.247059           10.4
#> 5:       Spain  Influenza            0.2        7.361538           43.7
#> 6: Spain SARS-CoV-2 0.8 10.626923 45.6# ILI consultation rates
ili_data <- get_ili_ari_rates(
date_min = as.Date("2024-01-01"),
date_max = as.Date("2024-12-31"),
indicator = "ILIconsultationrate",
age = c("0-4", "65+"),
countries = "France"
)
# Hospital admissions
severity_data <- get_nonsentinel_severity(
date_min = as.Date("2024-01-01"),
date_max = as.Date("2024-12-31"),
pathogen = "SARS-CoV-2",
indicator = "hospitaladmissions",
countries = c("France", "Spain")
)
# SARI positivity
sari_data <- get_sari_positivity(
date_min = as.Date("2024-01-01"),
date_max = as.Date("2024-12-31"),
pathogen = "Influenza",
indicator = "positivity",
countries = "EU/EEA"
)# All sources accessible via a single function
data <- get_erviss_data(
type = "nonsentinel_severity",
date_min = as.Date("2024-01-01"),
date_max = as.Date("2024-12-31"),
pathogen = "SARS-CoV-2",
indicator = "hospitaladmissions"
)The package includes optional plotting functions for quick
exploration. They return ggplot2 objects that can be
customized freely:
data <- get_sentineltests_positivity(
  date_min = as.Date("2024-01-01"),
  date_max = as.Date("2024-06-30"),
  pathogen = "SARS-CoV-2",
  countries = c("France", "Spain"),
  indicator = "positivity"
)
plot_erviss_positivity(data, date_breaks = "1 month")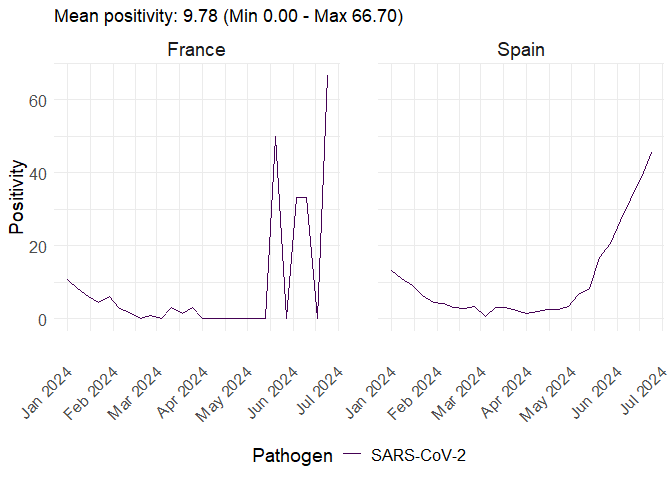
Or use the quick one-liners:
quick_plot_ili_ari_rates(
  date_min = as.Date("2024-01-01"),
  date_max = as.Date("2024-12-31"),
  indicator = "ILIconsultationrate",
  countries = c("France", "Spain"),
  date_breaks = "1 month"
)# If you have downloaded the data locally
data <- get_erviss_variants(
csv_file = "path/to/local/variants.csv",
date_min = as.Date("2024-01-01"),
date_max = as.Date("2024-12-31")
)| Function | Description |
|---|---|
get_sentineltests_positivity() |
Sentinel test positivity rates |
get_erviss_variants() |
SARS-CoV-2 variant data |
get_ili_ari_rates() |
ILI/ARI consultation rates |
get_sari_rates() |
SARI hospitalisation rates |
get_sari_positivity() |
SARI virological data |
get_nonsentinel_severity() |
Non-sentinel severity data |
get_nonsentinel_tests() |
Non-sentinel tests/detections |
get_erviss_data() |
Generic function (all types) |
| Function | Description |
|---|---|
plot_erviss_positivity() |
Plot positivity data |
plot_erviss_variants() |
Plot variant data |
plot_ili_ari_rates() |
Plot ILI/ARI rates |
plot_sari_rates() |
Plot SARI rates |
plot_sari_positivity() |
Plot SARI virological data |
plot_nonsentinel_severity() |
Plot severity data |
plot_nonsentinel_tests() |
Plot non-sentinel tests |
plot_erviss_data() |
Generic plot function |
quick_plot_*() |
Fetch + plot in one call |
| Function | Description |
|---|---|
get_erviss_url() |
Generic URL builder (all types) |
get_sentineltests_positivity_url() |
Positivity data URL |
get_erviss_variants_url() |
Variants data URL |
get_ili_ari_rates_url() |
ILI/ARI rates URL |
get_sari_rates_url() |
SARI rates URL |
get_sari_positivity_url() |
SARI virological data URL |
get_nonsentinel_severity_url() |
Non-sentinel severity URL |
get_nonsentinel_tests_url() |
Non-sentinel tests URL |
{ervissexplore}New contributors are welcome !
You can contribute to the package in many ways:
European Centre for Disease Prevention and Control. European Respiratory Virus Surveillance Summary (ERVISS), 2026, Week 05. Available at https://erviss.org/.