


The msarima package fits ARIMA models with more
than one seasonal component. Series observed at high frequency
often carry several cycles at once, such as the daily and the
weekly pattern of hourly data, while stats::arima() can
only take one of them. The package gives each period its own
autoregressive, differencing and moving average operator, estimated by
conditional maximum likelihood.
msarima() fits the model, with support for fixed
coefficients and a constant term.forecast() produces point forecasts and prediction
intervals.msarima.sim() and simulate() simulate from
a specification or from a fit.sacf() and spacf() draw correlograms that
mark the lags of each cycle (ggsacf() and
ggspacf() for the ggplot2 versions).msportmanteau() runs the multi-seasonal Ljung-Box and
Monti portmanteau tests on a series or on the residuals of a fit.You can install the stable version from CRAN:
install.packages("msarima")You can install the development version from GitHub:
# install.packages("devtools")
devtools::install_github("danigiro/msarima")MAD_m40 is the hourly number of vehicles recorded by a
sensor on the M-40 ring road of Madrid over the eight weeks from 3
February to 29 March 2024. It is an msts object with
periods 24 and 168, so the periods do not have to be repeated in every
call.
library(msarima)

plot(window(MAD_m40, end = 4), ylab = "vehicles per hour",
     main = "M-40, first four weeks (time in weeks)")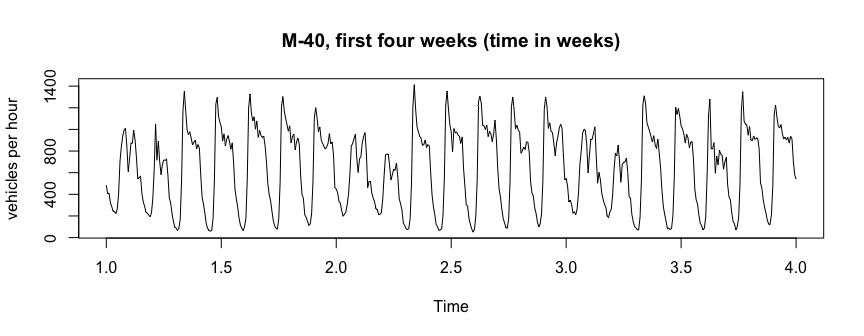
Both the daily cycle and the weekly one (weekends clearly lower) are
visible. order sets the non-seasonal part,
seasonal takes one c(P, D, Q) per period:
fit <- msarima(MAD_m40,
               order = c(1, 0, 2),
               seasonal = list(c(0, 1, 1), c(0, 1, 1)))
fit
#> Series: MAD_m40
#> mSARIMA(1,0,2)(0,1,1)[24](0,1,1)[168]
#>
#> Coefficients:
#>    AR(1)    MA(1)    MA(2) SMA(1,1) SMA(2,1)
#>   0.8847  -0.3737  -0.0906  -0.5603  -0.6836
#>
#> sigma^2 = 4009.7288  log likelihood = -5356.48
#> AIC = 10724.97   AICc = 10725.04   BIC = 10755.26
summary() adds standard errors and significance
tests:
summary(fit)
#> Series: MAD_m40
#> mSARIMA(1,0,2)(0,1,1)[24](0,1,1)[168]
#>
#> Coefficients:
#>          Estimate Std. Error z value Pr(>|z|)
#> AR(1)     0.88473    0.02473  35.770   <2e-16 ***
#> MA(1)    -0.37373    0.04060  -9.204   <2e-16 ***
#> MA(2)    -0.09059    0.03805  -2.381   0.0173 *
#> SMA(1,1) -0.56029    0.02700 -20.748   <2e-16 ***
#> SMA(2,1) -0.68362    0.02525 -27.072   <2e-16 ***
#> ---
#> Signif. codes:  0 '***' 0.001 '**' 0.01 '*' 0.05 '.' 0.1 ' ' 1
#>
#> sigma^2 = 4009.7288  log likelihood = -5356.4828
#> AIC = 10724.9656 AICc = 10725.0390 BIC = 10755.2612fc <- forecast(fit, h = 48)
plot(fc, include = 336, main = "Two days ahead", ylab = "vehicles per hour")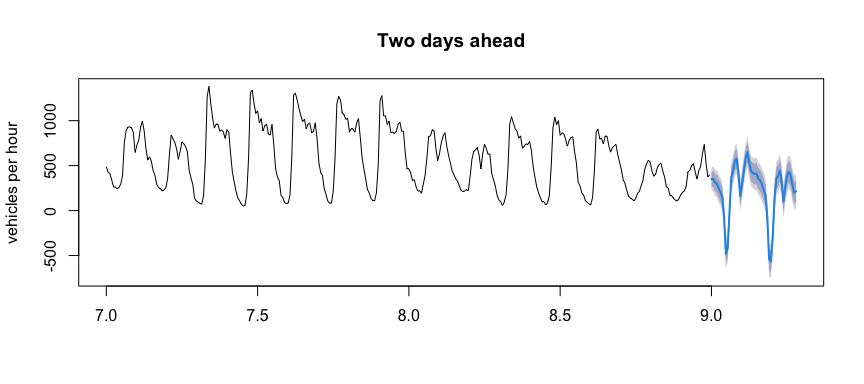
set.seed(1)
y <- msarima.sim(nsim = 500,
                 order = c(1, 0, 1),
                 seasonal = list(c(0, 0, 1), c(0, 0, 1)),
                 seasonal.period = c(7, 30),
                 ar = 0.6, ma = c(0.4, 0.3, 0.2),
                 sigma2 = 0.5)

y_sim <- simulate(fit, nsim = 168, seed = 1)fixed takes one entry per parameter, NA
where the parameter is to be estimated. The order is AR, seasonal AR,
MA, seasonal MA, sigma:
fit_fixed <- msarima(MAD_m40,
                     order = c(1, 0, 2),
                     seasonal = list(c(0, 1, 1), c(0, 1, 1)),
                     fixed = c(NA, NA, NA, -0.6, NA, NA))
c(free = AIC(fit), fixed = AIC(fit_fixed))
#>     free    fixed
#> 10724.97 10725.21vignette("msarima") walks through the package on
MAD_m40, from the correlograms to model choice and forecast
evaluation.
Lisi, F. and Grigoletto, M. (2025). Multiple seasonal autoregressive integrated moving average models. Journal of Forecasting, 44(6), 2037-2052. https://doi.org/10.1002/for.3283
Grigoletto, M. and Lisi, F. (2026). Portmanteau goodness-of-fit tests in the presence of simple, mixed, and multiple seasonal autocorrelation. arXiv. https://doi.org/10.48550/arXiv.2609.32381